Key Take Aways about Charting Software
- Charting software is crucial for finance professionals to visualize market data using charts and indicators.
- Common features include various chart types and technical indicators like moving averages and RSI.
- User interfaces allow customization and include tools for trend lines and support/resistance levels.
- Integrates with brokerage accounts for real-time data and offers multiple timeframes for analysis.
- Benefits include quick data interpretation, backtesting strategies, and risk management alerts.
- Cost varies; basic features might be free, while advanced ones typically require a subscription.
Introduction to Charting Software
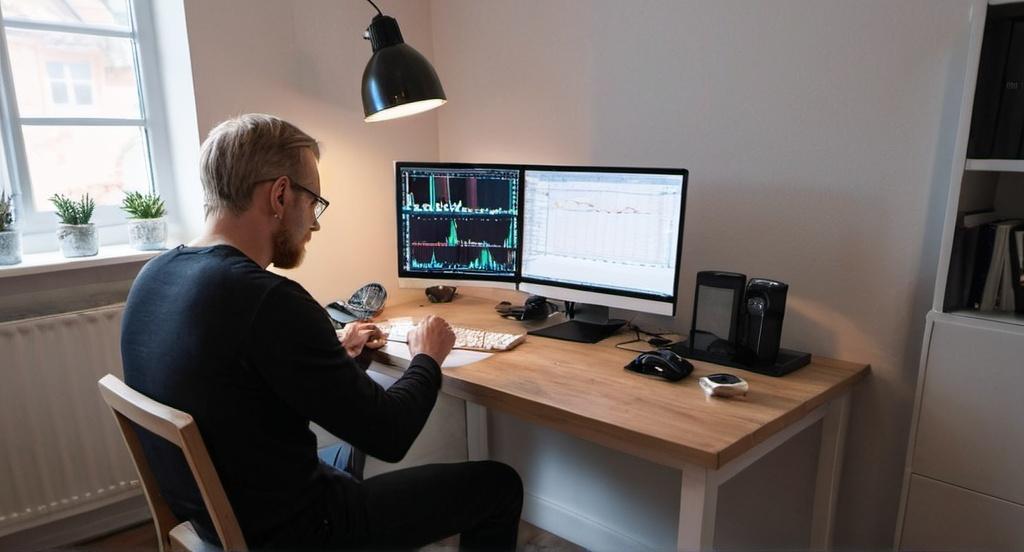
Charting software plays an essential role in the arsenal of finance professionals and traders. It offers the capability to visualize market data, enabling more informed decision-making through the use of charts, graphs, and technical indicators. Understanding the basic features, functions, and benefits of charting software can enhance trading strategies.
Features of Charting Software
The core functionality of charting software includes the ability to plot financial data visually. Most charting software provides a range of chart types, including line charts, bar charts, candlestick charts, and more complex options like Renko or Kagi charts. Each type has distinct strengths and can be more suitable for certain types of analysis.
Technical indicators are another critical component. These mathematical calculations are based on price, volume, or open interest and are used to predict future market trends. Popular indicators include moving averages, Bollinger Bands, and the Relative Strength Index (RSI).
Customization and User Interface
Modern charting software often emphasizes user customization. Features such as color schemes, layout adjustments, and indicator settings can be tailored to meet individual preferences. The user interface typically includes tools for drawing trend lines, Fibonacci retracements, and support/resistance levels. A well-designed interface can significantly impact the efficiency with which traders can analyze data and make decisions.
Data Integration and Timeframes
Another important aspect of charting software is data integration. Software platforms often connect directly with brokerage accounts or data feeds, providing real-time data access. Furthermore, users can select different timeframes for analysis, ranging from seconds to months, allowing for both short-term trading and long-term investment strategies.
Benefits of Using Charting Software
The primary benefit of using charting software is the ability to quickly interpret large amounts of data. Visual representations make it easier to spot trends, patterns, and anomalies that might not be immediately apparent from raw data.
Additionally, charting software often includes backtesting capabilities, enabling traders to test their strategies against historical data. This feature helps to refine trading strategies before risking real capital.
Risk Management and Strategy
Charting software assists with risk management by allowing traders to set alerts and notifications for specific price levels or technical indicator thresholds. This proactive approach helps manage potential losses and lock in profits.
Cost Considerations
While some charting software solutions offer basic features for free, advanced functionalities often require a paid subscription. It’s essential for users to assess their needs and choose a platform that balances cost with the necessary features.
Conclusion
Charting software is an indispensable tool for modern trading, providing essential insights through visual data representation. By facilitating technical analysis, enhancing decision-making processes, and offering risk management tools, charting software supports both novice and experienced traders in achieving their financial goals. As technology continues to evolve, the capabilities and accessibility of these platforms are expected to expand, further integrating advanced analytics and artificial intelligence.
Child Pages
- Bloomberg Terminal Charting App
- ChartStar Charting
- Finviz Charting
- Investing.com Charting App
- Koyfin Charting
- MarketSmith Charting
- MetaTrader 4 (MT4) Charting
- MetaTrader 5 (MT5) Charting
- MotiveWave Charting
- NinjaTrader Charting
- ProRealTime Charting
- Sierra Chart Charting
- StockCharts Charting
- TC2000 Charting
- Thinkorswim (by TD Ameritrade) Charting
- TickerChart Charting
- TradeStation Charting
- TradingView
- TrendSpider Charting
- Webull Charting